Tracing
Dgraph uses OpenTelemetry for distributed tracing across the Dgraph cluster.
Trace data is always collected within Dgraph. You can adjust the trace sampling rate for Dgraph queries using the --trace superflag's ratio option when running Dgraph Alpha and Zero nodes. By default, --trace ratio is set to 0.01 to trace 1% of queries.
Trace Superflag Options
The --trace superflag supports the following options:
| Option | Default | Description |
|---|---|---|
ratio | 0.01 | The ratio of queries to trace (0.0 to 1.0). Set to 1.0 to trace all queries. |
jaeger | (empty) | URL of Jaeger or OpenTelemetry Collector OTLP HTTP endpoint (e.g., http://localhost:4318). |
datadog | (empty) | URL of Datadog agent to send traces. |
service | (empty) | Custom service name for tracing. If set, overrides the default (dgraph.alpha or dgraph.zero). |
Example usage:
dgraph alpha --trace "ratio=1.0; jaeger=http://localhost:4318; service=alpha1;"
dgraph zero --trace "ratio=1.0; jaeger=http://localhost:4318; service=zero1;"
Examining Traces with zPages
The most basic way to view traces is with the integrated trace pages.
OpenTelemetry's zPages are accessible via the Zero or Alpha HTTP port at /debug/z.
Examining Traces with Jaeger
Jaeger collects distributed traces and provides a UI to view and query traces across different services. This provides the necessary observability to figure out what is happening in the system.
Dgraph exports traces to Jaeger using the OTLP HTTP protocol. Configure the --trace jaeger option to point to the Jaeger OTLP HTTP endpoint (port 4318 by default):
dgraph alpha --trace "jaeger=http://localhost:4318;"
dgraph zero --trace "jaeger=http://localhost:4318;"
See Jaeger's Getting Started docs to get up and running with Jaeger.
Setting up multiple Dgraph clusters with Jaeger
Jaeger allows you to examine traces from multiple Dgraph clusters. Use the --trace service option to give each Dgraph instance a unique service name:
# QA cluster
dgraph alpha --trace "jaeger=http://jaeger:4318; service=alpha-qa;"
dgraph zero --trace "jaeger=http://jaeger:4318; service=zero-qa;"

# Dev cluster
dgraph alpha --trace "jaeger=http://jaeger:4318; service=alpha-dev;"
dgraph zero --trace "jaeger=http://jaeger:4318; service=zero-dev;"
Dgraph also sets a service.namespace attribute on all spans, which preserves the original service type (dgraph.alpha or dgraph.zero) even when using custom service names. This allows filtering by namespace in the Jaeger UI.
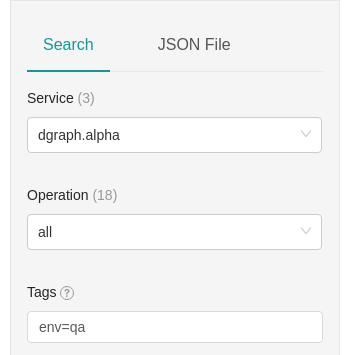
Once you have this configured, you can filter by service name in the Jaeger UI:
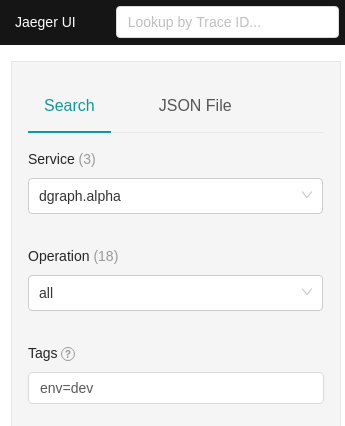
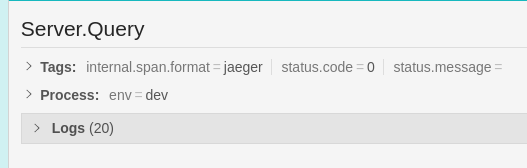
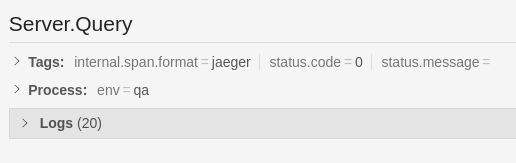
Every trace shows the service name under the "Process" section of each span:
To learn more about Jaeger, see Jaeger's Deployment Guide.
Using an OpenTelemetry Collector
Instead of sending traces directly to Jaeger, you can route them through an OpenTelemetry Collector for additional processing, filtering, or forwarding to multiple backends:
dgraph alpha --trace "jaeger=http://otel-collector:4318;"
The Collector can then be configured to export traces to Jaeger, Zipkin, Datadog, or any other supported backend.
Using Grafana Tempo
Grafana Tempo is a high-scale distributed tracing backend that natively supports OTLP. Configure Dgraph to send traces directly to Tempo's OTLP HTTP endpoint:
dgraph alpha --trace "jaeger=http://tempo:4318;"
dgraph zero --trace "jaeger=http://tempo:4318;"
Traces can then be visualized in Grafana using the Tempo data source.